![]()
![]()
![]()
![]()
![]()
![]()
Re: Mathematica plots
- To: mathgroup at smc.vnet.net
- Subject: [mg119419] Re: Mathematica plots
- From: Heike Gramberg <heike.gramberg at gmail.com>
- Date: Thu, 2 Jun 2011 19:10:43 -0400 (EDT)
As far as I know, you can't change the direction of the axes directly but you can get around this by using
the Ticks option. Suppose for example that you want to plot Exp[x] with the y-axis going from high to low,
then you could do something like
Plot[-Exp[x], {x, 1, 5}, Ticks -> {Automatic,
With[{range == Range[0, -Round[Exp[5]], -20]},
Transpose[{range, -range}]]}]
Heike.
On 2 Jun 2011, at 12:17, nivk wrote:
> Hi,
>
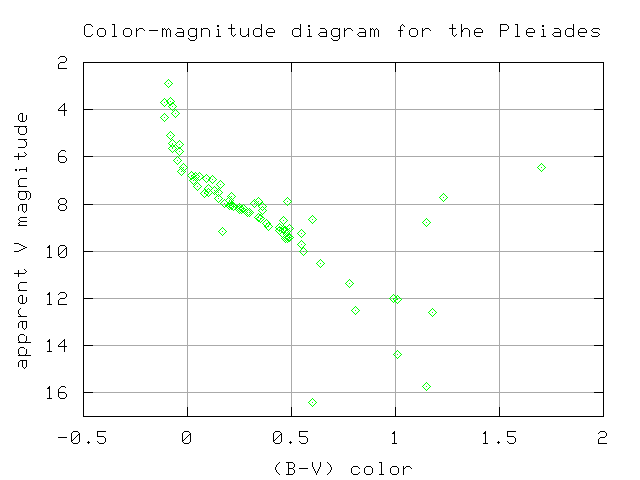
> I would like to know how to change the range of a plot on the y-axis to g=
o from larger to smaller numbers.
>
> Here's an example:
> http://spiff.rit.edu/classes/phys230/lectures/clusters/cm_pleiades.png
>
> I tried using PlotRange-> but that didn't make any difference.
>
> Thanks!
>