![]()
![]()
![]()
![]()
![]()
![]()
Re: Mathematica plots
- To: mathgroup at smc.vnet.net
- Subject: [mg119433] Re: Mathematica plots
- From: Murray Eisenberg <murray at math.umass.edu>
- Date: Thu, 2 Jun 2011 19:13:15 -0400 (EDT)
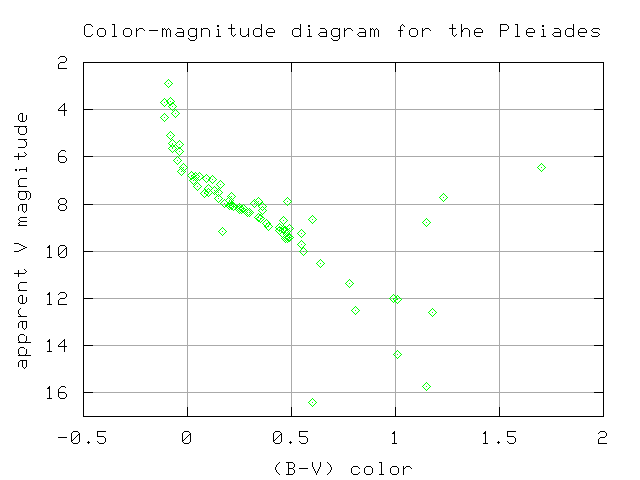
With David Park's "Presentations" packages
(http://home.comcast.net/~djmpark/DrawGraphicsPage.html), and in
particular his CustomTicks funciton, you could do it like this...

   Needs["Presentations`Master`"]

   (* will invert range from 0 to 1 *)
   inv[y_] := 1 - y

   (* First plot a function of a continuous variable: *)
   f[x_] := x^2
   Draw2D[{Draw[inv@f[x], {x, 0, 1}]},
          Axes -> True,
          Ticks -> {Automatic, CustomTicks[inv, {0, 1, 0.25, 1}]}]

   (* Second plot discrete data: *)
   noise = RandomReal[{-0.05, 0.05}, {20}];
   yvals = f[Rest@Range[0, 1, 0.05]] + noise

   Draw2D[{ListDraw[inv@yvals]},
          AspectRatio -> 1, Axes -> True,
          Ticks -> {Automatic, CustomTicks[inv, {0, 1, 0.25, 1}]}]


On 6/2/2011 7:17 AM, nivk wrote:
> Hi,
>
> I would like to know how to change the range of a plot on the y-axis to go from larger to smaller numbers.
>
> Here's an example:
> http://spiff.rit.edu/classes/phys230/lectures/clusters/cm_pleiades.png
>
> I tried using PlotRange->  but that didn't make any difference.
>
> Thanks!
>

--
Murray Eisenberg                     murray at math.umass.edu
Mathematics & Statistics Dept.
Lederle Graduate Research Tower      phone 413 549-1020 (H)
University of Massachusetts                413 545-2859 (W)
710 North Pleasant Street            fax   413 545-1801
Amherst, MA 01003-9305