![]()
![]()
![]()
![]()
![]()
![]()
Re: Mathematica plots
- To: mathgroup at smc.vnet.net
- Subject: [mg119435] Re: Mathematica plots
- From: Armand Tamzarian <mike.honeychurch at gmail.com>
- Date: Fri, 3 Jun 2011 04:36:49 -0400 (EDT)
- References: <is7rfg$rh6$1@smc.vnet.net>
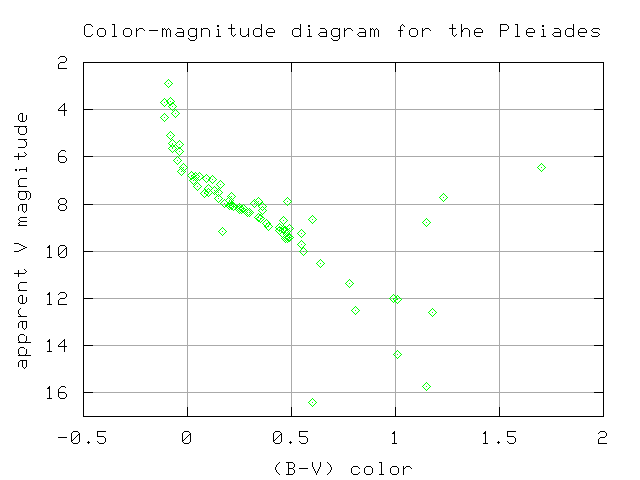
On Jun 2, 9:17 pm, nivk <nina... at gmail.com> wrote:
> Hi,
>
> I would like to know how to change the range of a plot on the y-axis to go from larger to smaller numbers.
>
> Here's an example:http://spiff.rit.edu/classes/phys230/lectures/clusters/cm_pleiades.png
>
> I tried using PlotRange-> but that didn't make any difference.
>
> Thanks!

This might be what you are looking for:

http://library.wolfram.com/infocenter/MathSource/7525/

Mike